Файл с расширением .dmp

Файл DMP — это дамп памяти Microsoft Windows, содержащий отладочную информацию и основные данные о системе на момент его создания, например, список загруженных драйверов, сведения о вызвавшем ошибку процессе и т.п. Как правило, дампы памяти создаются при критических ошибках операционной системы или появлении синего экрана смерти BSOD, и используются для определения причин сбоя в работе компьютера. Пользователи Windows могут настроить автоматическое создание дампа памяти в окне «Свойства системы» > «Загрузка и восстановление».
В Windows существует несколько типов дампа памяти: малый (мини) дамп, дамп памяти ядра, полный дамп памяти и активный дамп памяти. Полный дамп включает «снимок» оперативной памяти на момент сбоя и имеет размер, равный объему ОЗУ компьютера. Для определения причины сбоя ОС достаточно файла мини дампа, который имеет небольшой размер и хранит основную информацию о системных процессах. Малые дампы памяти расположены в папке C:\Windows\Minidump, а полный дамп памяти хранится в файле C:\Windows\MEMORY.DMP.
Просмотр и анализ файлов DMP возможен с помощью специализированных программ, например, Windows Debugging Tools или BlueScreenView. Если со временем файлы дампов начинают занимать много места на жестком диске компьютера, то для их удаления можно воспользоваться стандартной утилитой Windows «Очистка диска».
Формат файла DMP — описание, как открыть?
Файл формата DMP открывается специальными программами. Чтобы открыть данный формат, скачайте одну из предложенных программ.
Чем открыть файл в формате DMP
Расширение DMP может быть нескольких основных исполнений, в частности:
- DMP формат является dump-файлом, генерируемым ОС в автоматическом режиме в результате появления какой-либо критической ошибки. Это своеобразный скриншот памяти устройства в момент, когда ОС дает сбой. Dump-файл с ошибкой ОС имеет формат mini000000-00.dmp, где в наименовании указывается конкретный месяц, год и дата фиксации сбоя.
Для непосредственной генерации дампа, а не просто перезагрузки ОС, следует выполнить следующую последовательность действий:
- перейти по пути “мой компьютер – свойства – восстановление компонентов – параметры”;
- снять закладку ”перезагрузка”;
- во вкладке “запись отладочных данных” пользователю предоставляется выбрать вид дамп-файла, и каталог, где он будет сгенерирован.
В случае, если DMP файл занимает значительное место дискового пространства, их допускается удалять. Данная процедура никак не повлияет на работоспособность ОС.
- формат DMP – результат деятельности программного комплекса баз данных ORACLE. Такой файл предназначен для резервного хранения схем и БД (актуально только на момент его генерации).
- dump-файл программы Steam. Предназначен для контроля и управления над игровыми приложениями.
- DMP формат – файл-карта, как результат генерации утилиты Dream Maker.
Программы для открытия и создания DMP файлов
В зависимости от своего исполнения и практического назначения, DMP формат может быть сгенерирован и открыт следующими программными приложениями:
- Visual Studio, Dumpflop Utility, Kernel Debug, Bluescreenview, Debug Tools, (DMP файл – генерируемый операционной системой в автоматическом режиме в случае возникновения какой-либо критической ошибки или сбоя);
- Oracle Dump Viewer (DMP файл – БД ORACLE);
- Steam (DMP файл – клиент для контроля и управления над игровыми приложениями);
- Dream Maker (DMP файл – файл-карта).
Если при попытке открыть формат ОС выдает ошибку, – производится открытие DMP файла с использованием некорректного приложения.
Конвертация DMP в другие форматы
Поскольку DMP формат – уникальный файл, содержащий данные о коде критической ошибке или причинах сбоя ОС, конвертация его в другие форматы не практикуется.
Исключение составляет, пожалуй, только дамп-файл базы данных ORACLE. С помощью программной утилиты NXTract допускается преобразование в CSV, SQL Server, DB2, Access, MySQL и многие другие форматы.
Почему именно DMP и в чем его достоинства?
Область практического применения формата DMP необычайно широка. С помощью данного расширения пользователю предоставляется возможность безошибочно диагностировать причину сбоя ОС, создать резервную копию БД ORACLE, управлять игровыми программами и создавать файл-карты.
Тип файла: Windows Memory Dump Разработчик: Microsoft Категория: Системные файлы
Данные, «сброшенные» из памяти программы. Часто создается при ошибке или отказе программы. Может также сохраняться программой «Savedump.exe» при первой перезагрузке после отказа. Обычно носит название «Memory.dmp».
Файлы дампа памяти Windows могут применяться для разрешения ошибок системы и других проблем. Но они могут занимать значительное количество пространства и зачастую удаляются.
Чем открыть файл в формате DMP (Windows Memory Dump)
How to read the small memory dump file that is created by Windows if a crash occurs
This article describes how to examine a small memory dump file. A small memory dump file can help you determine why your computer failed.
Applies to All supported versions of Windows Client and Windows Server
Original KB number: 315263
If you are looking for debug information for Windows 8 or later, see Debugging Tools for Windows (WinDbg, KD, CDB, NTSD). For more information about small memory dump, see Small Memory Dump.
Small memory dump files
If your computer fails, how can you determine what occurred, fix the issue, and it prevent it from occurring again? You may find the small memory dump file useful in this situation. The small memory dump file contains the smallest amount of useful information that could help you identify why your computer failed. The memory dump file contains the following information:
- The Stop message, its parameters, and other data
- A list of loaded drivers
- The processor context (PRCB) for the processor that stopped
- The process information and kernel context (EPROCESS) for the process that stopped
- The process information and kernel context (ETHREAD) for the thread that stopped
- The Kernel-mode call stack for the thread that stopped
To create a memory dump file, Windows requires a paging file on the boot volume that is at least 2 megabytes (MB). On computers that are running Microsoft Windows 2000, or a later version of Windows, a new memory dump file is created every time that a computer failure may occur. A history of these files is stored in a folder. If a second problem occurs, and if Windows creates a second small memory dump file, Windows preserves the previous file. Windows gives each file a distinct, date-encoded file name. For example, Mini022900-01.dmp is the first memory dump file that was generated on February 29, 2000. Windows keeps a list of all the small memory dump files in the %SystemRoot%\Minidump folder.
The small memory dump file can be useful if hard disk space is limited. However, because of the limited information that is included, errors that were not directly caused by the thread that was running at the time of the problem may not be discovered by an analysis of this file.
Configure the dump type
To configure startup and recovery options to use the small memory dump file, follow these steps.
The following steps may be different on your computer depending on your version of Windows. If they differ, see your product documentation to complete these steps.
- Select Start >Control Panel.
- Double-click System, and then select Advanced system settings >Advanced.
- Under Startup and Recovery, select Settings.
- In the Write debugging information list, select Small memory dump (256k).
To change the folder location for the small memory dump files, type a new path in the Dump File box or in the Small dump directory box (depending on your version of Windows).
Tools to read the small memory dump file
Use the Dump Check Utility (Dumpchk.exe) to read a memory dump file or verify that the file was created correctly.
The Dump Check Utility does not require access to debugging symbols. Symbol files hold a variety of data that is actually not needed when you run the binaries. However, this data could be very useful in debugging.
For more information about how to use Dump Check Utility in Windows NT, Windows 2000, Windows Server 2003 or Windows Server 2008, see Use Dumpchk.exe to check a memory dump file.
For more information about how to use Dump Check Utility in Windows XP, Windows Vista, or Windows 7, see How to use Dumpchk.exe to check a Memory Dump file.
Or, you can use the Windows Debugger (WinDbg.exe) tool or the Kernel Debugger (KD.exe) tool to read small memory dump files. WinDbg.exe and KD.exe are included with the latest version of the Debugging Tools for Windows package.
To install the debugging tools, see the Download and Install Debugging Tools for Windows webpage. Select the Typical installation. By default, the installer installs the debugging tools in the following folder:
C:\Program Files\Debugging Tools for Windows
The tool webpage also provides access to the downloadable symbol packages for Windows. For more information about Windows symbols, see Debugging with Symbols, and the Download Windows Symbol Packages webpage.
For more information about dump file options in Windows, see Overview of memory dump file options for Windows.
Open the dump file
To open the dump file after the installation is complete, follow these steps:
- Select Start >Run, type cmd , and then select OK.
- Change to the Debugging Tools for Windows folder. To do this, type the following at the command prompt, and then press ENTER:
cd C:\Program Files\Debugging Tools For Windows windbg -y SymbolPath -i ImagePath -z DumpFilePath kd -y SymbolPath -i ImagePath -z DumpFilePath The following table explains the use of the placeholders that are used in these commands.
| Placeholder | Explanation |
|---|---|
| SymbolPath | Either the local path where the symbol files have been downloaded or the symbol server path, including a cache folder. Because a small memory dump file contains limited information, the actual binary files must be loaded together with the symbols in order for the dump file to be correctly read. |
| ImagePath | The path of these files. The files are contained in the I386 folder on the Windows XP CD-ROM. For example, the path may be C:\Windows\I386 . |
| DumpFilePath | The path and file name for the dump file that you are examining. |
Sample commands
You can use the following sample commands to open the dump file. These commands assume the following:
- The contents of the I386 folder on the Windows CD-ROM are copied to the C:\Windows\I386 folder.
- The dump file is named C:\Windows\Minidump\Minidump.dmp.
Sample 1 (command line):
kd -y srv*C:\Symbols*https://msdl.microsoft.com/download/symbols -i C:\Windows\i386 -z C:\Windows\Minidump\minidump.dmp Sample 2 (graphical UI). If you prefer the graphical version of the debugger instead of the command-line version, type the following command instead:
windbg -y srv*C:\Symbols*https://msdl.microsoft.com/download/symbols -i C:\Windows\i386 -z C:\Windows\Minidump\minidump.dmp Examine the dump file
There are several commands that you can use to gather information in the dump file, including the following commands:
- The !analyze -show command displays the Stop error code and its parameters. The Stop error code is also known as the bug check code.
- The !analyze -v command displays verbose output.
- The lm N T command lists the specified loaded modules. The output includes the status and the path of the module.
In older versions of Windows (pre-dating Windows XP) the !drivers extension command displays a list of all drivers that are loaded on the destination computer, together with summary information about their memory use. However, the !drivers extension command is obsolete in Windows XP and later versions. To display information about loaded drivers and other modules, use the lm command. The lm N T command displays information in a format that is similar to the old !drivers extension.
For help with other commands and for complete command syntax, see the debugging tools Help documentation. The debugging tools Help documentation can be found in the following location:
C:\Program Files\Debugging Tools for Windows\Debugger.chm
If you have symbol-related issues, use the Symchk utility to verify that the correct symbols are loaded correctly. For more information about how to use Symchk, see Debugging with Symbols.
Simplify the commands by using a batch file
After you identify the command that you must use to load memory dumps, you can create a batch file to examine a dump file. For example, create a batch file and name it Dump.bat. Save it in the folder where the debugging tools are installed. Type the following text in the batch file:
cd "C:\Program Files\Debugging Tools for Windows" kd -y srv*C:\Symbols*https://msdl.microsoft.com/download/symbols -i C:\Windows\i386 -z %1 When you want to examine a dump file, type the following command to pass the dump file path to the batch file:
dump C:\Windows\Minidump\minidump.dmp Как открыть DMP-файл в WinDbg Windows 10

Когда происходит сбой операционной системы Windows 10, система создает файл дампа памяти, содержащий информацию о возникновения ошибки, которая может помочь определить причину проблемы. В статье покажу, как открыть и анализировать .dmp файл в Windows 10.
Что такое файл DMP?
Файл «.dmp» содержит сообщение об ошибке, список драйверов, загруженных во время сбоя, а также сведения о ядре, процессоре и процессах.
Windows 10 создает файлы дампа автоматически, но в самой ОС нет никаких встроенных инструментов, которые смогли бы откырть файл дампа. Чтобы открыть dmp-файл мы воспользуемся программой Microsoft WinDbg.
WinDbg (отладка Windows) — это инструмент, который был разработан для отладки кода в режиме ядра и в режиме пользователя, проверки реестров процессора и анализа аварийных дампов.
В этом руководстве по Windows 10 мы покажем вам, как открыть файл дампа, чтобы попытаться выяснить, что вызвало сбой, чтобы решить проблему на вашем компьютере.
Как открыть файл дампа с помощью WinDbg
В Windows 10 вы можете найти несколько способов открыть и просмотреть файл с ошибкой дампа, но самый простой способ — использовать инструмент WinDbg, доступный в Microsoft Store.
Установка WinDbg
Чтобы установить инструмент WinDbg в Windows 10, выполните следующие действия:
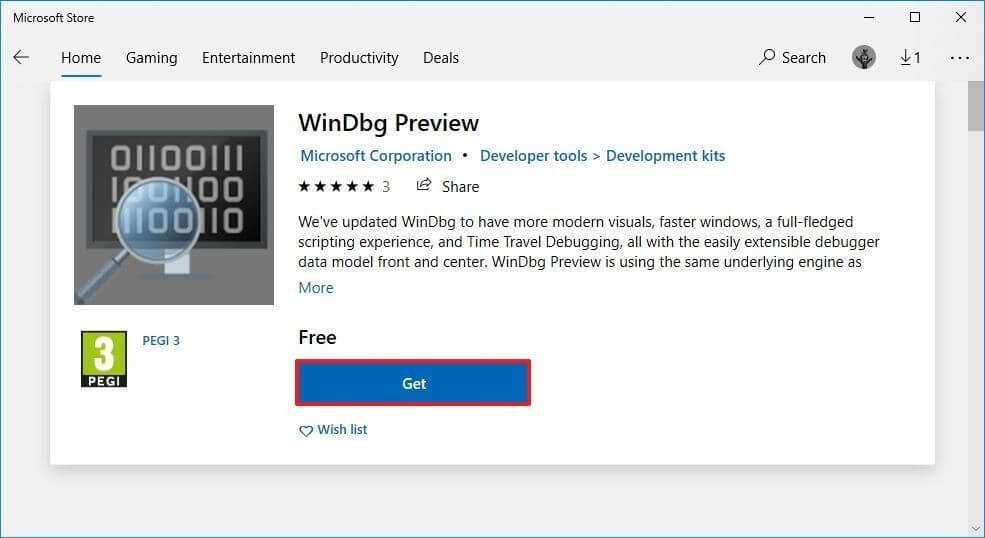
- Перейдите на страницу загрузки WinDbg.
- Нажмите кнопку «Получить».
- Нажмите кнопку «Открыть».
- Нажмите кнопку «Установить».
После того, как вы выполните эти шаги, приложение будет установлено, и оно будет доступно в меню «Пуск».
Анализ файла DMP
Чтобы открыть и проанализировать файл дампа, созданный в результате сбоя в Windows 10, выполните следующие действия:
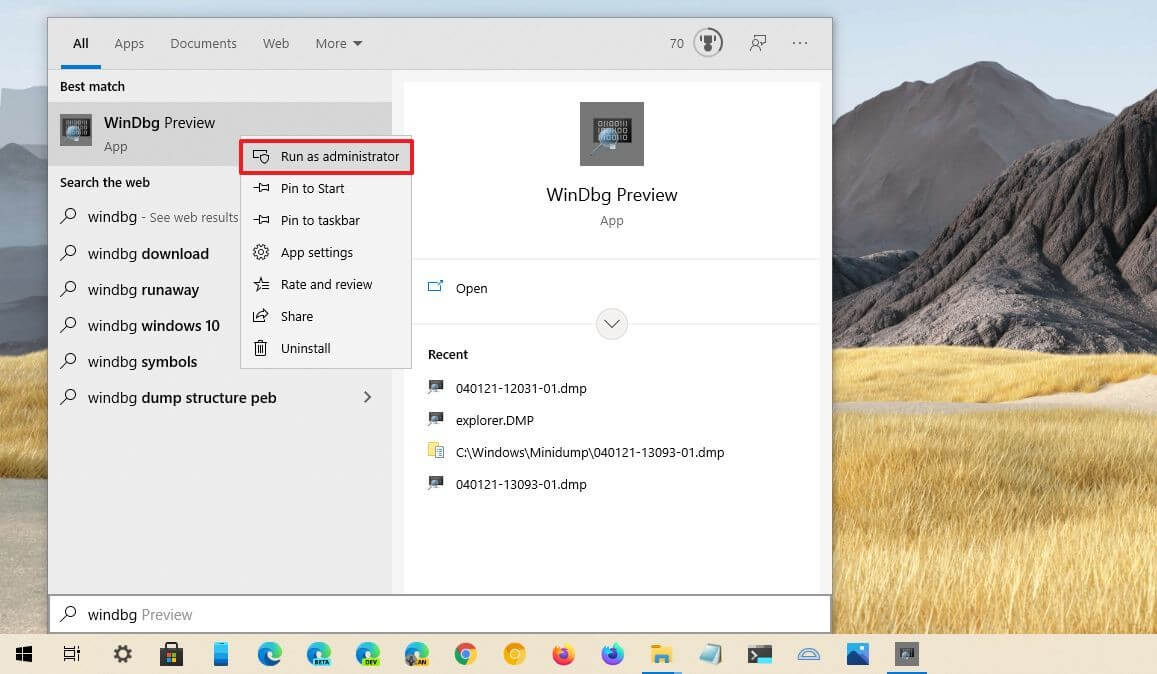
Шаг 1: Откройте Пуск.
Шаг 2: Нажмите на иконку поиска, введите WinDbg и нажав правым кликом по WinDbg выберите параметр «Запуск от имени администратора».
Шаг 3: В меню программы откройте пункт «Файл».
Шаг 4: Нажмите «Начать отладку».
Шаг 5: Выберите «Открыть дамп файл».
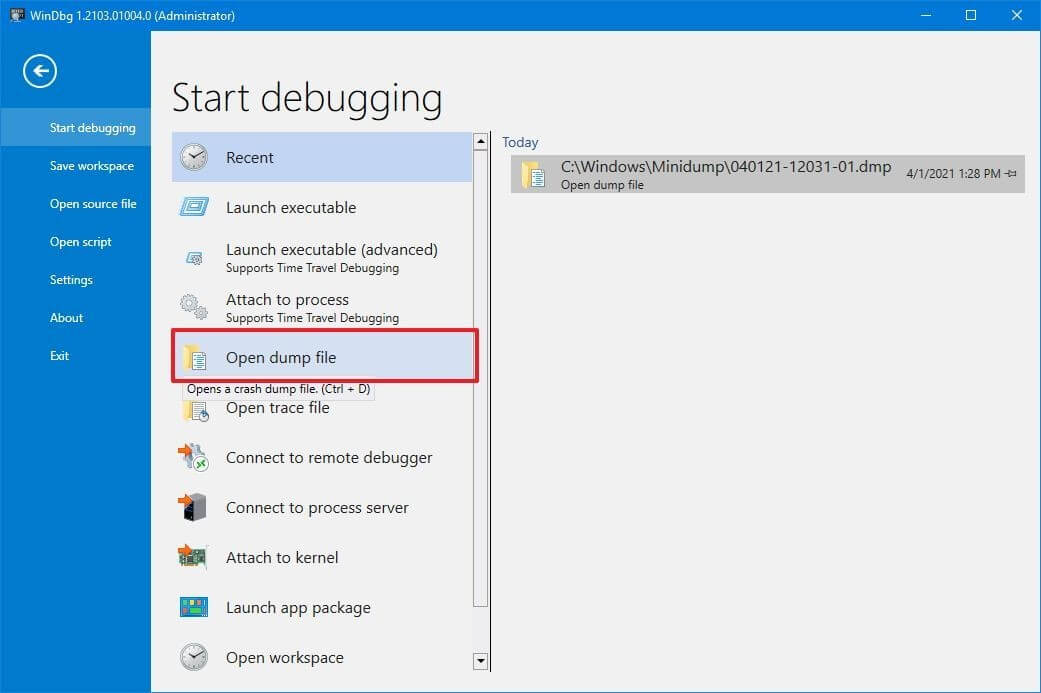
Шаг 6: Выберите файл дампа в папке, например:
Шаг 7: Нажмите кнопку «Открыть».

Шаг 8: Дождитесь окончания (это может занять некоторое время).
Шаг 9: Введите следующую команду в команде запуска и нажмите Enter:

Совет: вы также можете щелкнуть ссылку! Анализировать -v, если она доступна, в основной области, если она доступна после загрузки файла дампа.
Шаг 10: Проверяйте индикатор выполнения, пока анализ не будет завершен (это может занять много времени в зависимости от размера данных).
После того, как вы выполните эти шаги, приложение вернет анализ файла дампа, который вы затем сможете просмотреть, чтобы определить причину проблемы, чтобы помочь вам решить проблему.
Информация будет разной в зависимости от проблемы. Например, этот тестовый файл дампа показывает информацию о синем экране смерти (BSoD), также известном как проверка ошибок.
Результат указывает на то, что это был сбой, инициированный вручную с кодом ошибки «e2», что является правильным, поскольку в целях данного руководства мы используем эти инструкции для принудительного выполнения BSoD. WinDbg даже отлично описывает сбой на языке, понятном любому (пользователь вручную инициировал этот аварийный дамп).
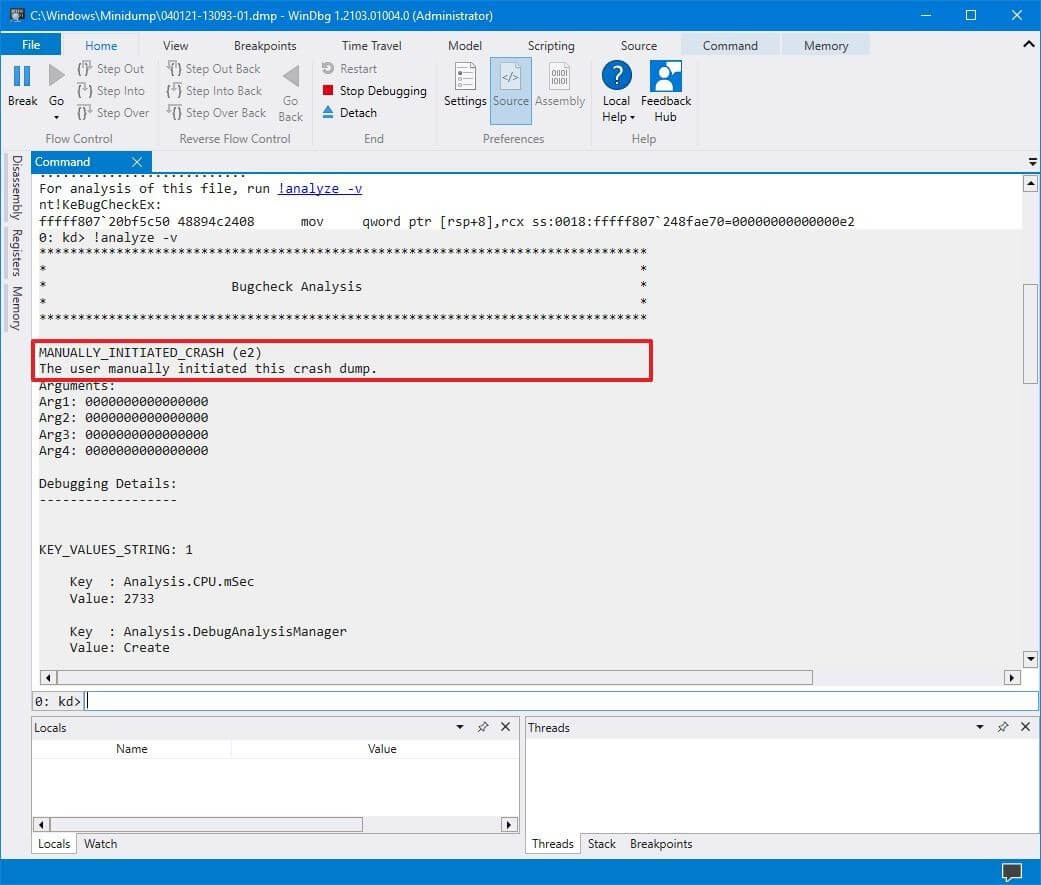
Продолжая просматривать файл дампа, вы также найдете дополнительную информацию, такую как «FAILURE_BUCKET_ID» и «MODULE_NAME», которые могут указывать на причину проблемы.

Информация может быть огромной, поскольку она не предназначена для обычных пользователей.
Заключение
Если ваш компьютер продолжает давать сбой, вы можете использовать этот инструмент, чтобы понять проблему. Если вы не можете понять это, вы можете использовать подсказки в отчете для поиска в Интернете дополнительной информации.