9 команд для проверки информации о CPU в Linux

Информация о CPU (Central Processing Unit. Центральный процессор) включает в себя подробные сведения о процессоре, такие как архитектура, название производителя, модель, количество ядер, скорость каждого ядра и т.д.
В linux существует довольно много команд для получения подробной информации о CPU.
В этой статье мы рассмотрим некоторые из часто встречающихся команд, которые можно использовать для получения подробной информации о CPU.
1. /proc/cpuinfo
Файл /proc/cpuinfo содержит подробную информацию об отдельных ядрах CPU.
Выведите его содержимое с помощью less или cat .
$ less /proc/cpuinfo processor : 0 vendor_id : GenuineIntel cpu family : 6 model : 23 model name : Intel(R) Core(TM)2 Quad CPU Q8400 @ 2.66GHz stepping : 10 microcode : 0xa07 cpu MHz : 1998.000 cache size : 2048 KB physical id : 0 siblings : 4 core id : 0 cpu cores : 4 apicid : 0 initial apicid : 0 fpu : yes fpu_exception : yes cpuid level : 13 wp : yes flags : fpu vme de pse tsc msr pae mce cx8 apic sep mtrr pge mca cmov pat pse36 clflush dts acpi mmx fxsr sse sse2 ss ht tm pbe syscall nx lm constant_tsc arch_perfmon pebs bts rep_good nopl aperfmperf pni dtes64 monitor ds_cpl vmx est tm2 ssse3 cx16 xtpr pdcm sse4_1 xsave lahf_lm dtherm tpr_shadow vnmi flexpriority bogomips : 5303.14 clflush size : 64 cache_alignment : 64 address sizes : 36 bits physical, 48 bits virtual power management:Каждый процессор или ядро перечислены отдельно, а различные подробности о скорости, размере кэша и названии модели включены в описание.
Чтобы подсчитать количество процессоров, используйте grep с wc
$ cat /proc/cpuinfo | grep processor | wc -l 4Количество процессоров, показанное в /proc/cpuinfo, может не соответствовать реальному количеству ядер процессора. Например, процессор с 2 ядрами и гиперпоточностью будет показан как процессор с 4 ядрами.
Чтобы получить фактическое количество ядер, проверьте идентификатор ядра на наличие уникальных значений
$ cat /proc/cpuinfo | grep 'core id' core id : 0 core id : 2 core id : 1 core id : 3Соответственно, есть 4 разных идентификатора ядра. Это указывает на то, что существует 4 реальных ядра.
2. lscpu — отображение информации об архитектуре CPU
lscpu — это небольшая и быстрая команда, не требующая никаких опций. Она просто выводит информацию об аппаратном обеспечении CPU в удобном для пользователя формате.
$ lscpu Architecture: x86_64 CPU op-mode(s): 32-bit, 64-bit Byte Order: Little Endian CPU(s): 4 On-line CPU(s) list: 0-3 Thread(s) per core: 1 Core(s) per socket: 4 Socket(s): 1 NUMA node(s): 1 Vendor ID: GenuineIntel CPU family: 6 Model: 23 Stepping: 10 CPU MHz: 1998.000 BogoMIPS: 5303.14 Virtualization: VT-x L1d cache: 32K L1i cache: 32K L2 cache: 2048K NUMA node0 CPU(s): 0-33. hardinfo
Hardinfo — это gui инструмент на базе gtk, который генерирует отчеты о различных аппаратных компонентах. Но он также может запускаться из командной строки, в случае если отсутствует возможность отображения gui (Graphical User Interface — графический интерфейс пользователя).
$ hardinfo | lessОн создаст большой отчет о многих аппаратных частях, читая файлы из каталога /proc. Информация о CPU находится в начале отчета. Отчет также может быть записан в текстовый файл.
Hardinfo выполняет несколько эталонных тестов, занимающих несколько минут, прежде чем вывести отчет на экран.
4. lshw
Команда lshw может отобразить ограниченную информацию о CPU. lshw по умолчанию показывает информацию о различных аппаратных частях, а опция ‘ -class ‘ может быть использована для сбора информации о конкретной аппаратной части.
$ sudo lshw -class processor *-cpu description: CPU product: Intel(R) Core(TM)2 Quad CPU Q8400 @ 2.66GHz vendor: Intel Corp. physical id: 0 bus info: cpu@0 version: Intel(R) Core(TM)2 Quad CPU Q8400 @ 2.66GHz slot: LGA 775 size: 1998MHz capacity: 4GHz width: 64 bits clock: 333MHz capabilities: fpu fpu_exception wp vme de pse tsc msr pae mce cx8 apic sep mtrr pge mca cmov pat pse36 clflush dts acpi mmx fxsr sse sse2 ss ht tm pbe syscall nx x86-64 constant_tsc arch_perfmon pebs bts rep_good nopl aperfmperf pni dtes64 monitor ds_cpl vmx est tm2 ssse3 cx16 xtpr pdcm sse4_1 xsave lahf_lm dtherm tpr_shadow vnmi flexpriority cpufreqПроизводитель, модель и скорость процессора отображаются правильно. Однако из приведенного выше результата невозможно определить количество ядер в процессоре.
Чтобы узнать больше о команде lshw, ознакомьтесь с этой статьей:
5. nproc
Команда nproc просто выводит количество доступных вычислительных блоков. Обратите внимание, что количество вычислительных блоков не всегда совпадает с количеством ядер.
$ nproc 46. dmidecode
Команда dmidecode отображает некоторую информацию о CPU, которая включает в себя тип сокета, наименование производителя и различные флаги.
$ sudo dmidecode -t 4 # dmidecode 2.12 SMBIOS 2.4 present. Handle 0x0000, DMI type 4, 35 bytes Processor Information Socket Designation: LGA 775 Type: Central Processor Family: Pentium D Manufacturer: Intel(R) Corporation ID: 7A 06 01 00 FF FB EB BF Signature: Type 0, Family 6, Model 23, Stepping 10 Flags: FPU (Floating-point unit on-chip) VME (Virtual mode extension) DE (Debugging extension) PSE (Page size extension) TSC (Time stamp counter) MSR (Model specific registers) PAE (Physical address extension) MCE (Machine check exception) CX8 (CMPXCHG8 instruction supported) APIC (On-chip APIC hardware supported) SEP (Fast system call) MTRR (Memory type range registers) PGE (Page global enable) MCA (Machine check architecture) CMOV (Conditional move instruction supported) PAT (Page attribute table) PSE-36 (36-bit page size extension) CLFSH (CLFLUSH instruction supported) DS (Debug store) ACPI (ACPI supported) MMX (MMX technology supported) FXSR (FXSAVE and FXSTOR instructions supported) SSE (Streaming SIMD extensions) SSE2 (Streaming SIMD extensions 2) SS (Self-snoop) HTT (Multi-threading) TM (Thermal monitor supported) PBE (Pending break enabled) Version: Intel(R) Core(TM)2 Quad CPU Q8400 @ 2.66GHz Voltage: 1.6 V External Clock: 333 MHz Max Speed: 4000 MHz Current Speed: 2666 MHz Status: Populated, Enabled Upgrade: Socket LGA775 L1 Cache Handle: 0x0003 L2 Cache Handle: 0x0001 L3 Cache Handle: Not Provided Serial Number: Not Specified Asset Tag: Not Specified Part Number: Not Specified7. cpuid
Команда cpuid собирает информацию CPUID о процессорах Intel и AMD x86.
Программа может быть установлена с помощью apt на ubuntu
$ sudo apt-get install cpuidА вот пример вывода
$ cpuid . Vendor ID: "GenuineIntel"; CPUID level 13 Intel-specific functions: Version 0001067a: Type 0 - Original OEM Family 6 - Pentium Pro Model 7 - Pentium III/Pentium III Xeon - external L2 cache Stepping 10 Reserved 4 Extended brand string: "Intel(R) Core(TM)2 Quad CPU Q8400 @ 2.66GHz" CLFLUSH instruction cache line size: 8 Initial APIC ID: 2 Hyper threading siblings: 4 Feature flags bfebfbff: FPU Floating Point Unit VME Virtual 8086 Mode Enhancements DE Debugging Extensions PSE Page Size Extensions TSC Time Stamp Counter MSR Model Specific Registers PAE Physical Address Extension MCE Machine Check Exception CX8 COMPXCHG8B Instruction APIC On-chip Advanced Programmable Interrupt Controller present and enabled SEP Fast System Call MTRR Memory Type Range Registers PGE PTE Global Flag MCA Machine Check Architecture CMOV Conditional Move and Compare Instructions FGPAT Page Attribute Table PSE-36 36-bit Page Size Extension CLFSH CFLUSH instruction DS Debug store ACPI Thermal Monitor and Clock Ctrl MMX MMX instruction set FXSR Fast FP/MMX Streaming SIMD Extensions save/restore SSE Streaming SIMD Extensions instruction set SSE2 SSE2 extensions SS Self Snoop HT Hyper Threading TM Thermal monitor 31 reserved . 8. inxi
Inxi — это скрипт, который использует другие программы для создания хорошо структурированного легко читаемого отчета о различных аппаратных компонентах системы. Ознакомьтесь с полным руководством по inxi.
$ sudo apt-get install inxiВывод соответствующей информации о CPU/процессоре
$ inxi -C CPU: Quad core Intel Core2 Quad CPU Q8400 (-MCP-) cache: 2048 KB flags: (lm nx sse sse2 sse3 sse4_1 ssse3 vmx) Clock Speeds: 1: 1998.00 MHz 2: 1998.00 MHz 3: 1998.00 MHz 4: 1998.00 MHzЧтобы узнать больше о команде inxi и ее использовании, ознакомьтесь с этой статьей:
9. Hwinfo
Команда hwinfo — это программа для получения информации об оборудовании, которая может быть использована для сбора подробных сведений о различных аппаратных компонентах в системе Linux.
Она также отображает информацию о процессоре. Вот быстрый пример:
$ hwinfo --short --cpu cpu: Intel(R) Core(TM) i5-7400 CPU @ 3.00GHz, 2275 MHz Intel(R) Core(TM) i5-7400 CPU @ 3.00GHz, 2262 MHz Intel(R) Core(TM) i5-7400 CPU @ 3.00GHz, 2058 MHz Intel(R) Core(TM) i5-7400 CPU @ 3.00GHz, 2133 MHz $Если не использовать опцию «—short», команда отобразит гораздо больше информации о каждом ядре CPU, например, архитектуру и характеристики процессора.
Чтобы более подробно изучить команду hwinfo, ознакомьтесь с этой статьей:
Заключение
Это были некоторые команды для проверки информации о CPU в системах на базе Linux, таких как Ubuntu, Fedora, Debian, CentOS и др.
Примеры других команд для проверки информации о CPU смотрите в этой статье:
Большинство команд обрабатываются с помощью интерфейса командной строки и выводятся в текстовом формате. Для GUI интерфейса используйте программу Hardinfo.
Она показывает подробности об аппаратном обеспечении различных компонентов в простом для использования GUI интерфейсе.
Если вы знаете какую-либо другую полезную команду, которая может отображать информацию о CPU, сообщите нам об этом в комментариях ниже
Материал подготовлен в рамках курса Administrator Linux. Professional.
Если вы хотели бы узнать подробнее о формате обучения и программе, познакомиться с преподавателем курса — приглашаем на день открытых дверей онлайн. Регистрация здесь.
А если вам интересно развитие в этой сфере с нуля до pro, рекомендуем ознакомиться с учебной программой специализации.
- linux administration
- linux команды
- linux server
- cpu
- Блог компании OTUS
- Настройка Linux
TOP’ай сюда
Обзор практически всех *top утилит под linux (atop, iotop, htop, foobartop и т.д.).
Все мы знаем top — самую простую и самую распространённую утилиту из этого списка. Показывает примерно то же, что утилита vmstat, плюс рейтинг процессов по потреблению памяти или процессора. Совсем ничего не знает про загрузку сети или дисков. Позволяет минимальный набор операций с процессом: renice, kill (в смысле отправки сигнала, убийство — частный случай). По имени top суффикс «-top» получили и все остальные подобные утилиты в этом обзоре.
atop
Atop имеет два режима работы — сбор статистики и наблюдение за системой в реальном времени. В режиме сбора статистики atop запускается как демон и раз в N времени (обычно 10 мин) скидывает состояние в двоичный журнал. Потом по этому журналу atop’ом же (ключ -r и имя лог-файла) можно бегать вперёд-назад кнопками T и t, наблюдая показания atop’а с усреднением за 10 минут в любой интересный момент времени.
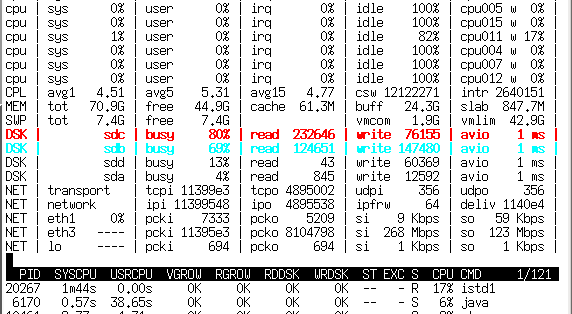
В отличие от top отлично знает про существование блочных устройств и сетевых интерфейса, способен показывать их загрузку в процентах (на 10G, правда, процентов не получается, но хотя бы показывается количество мегабит).
Незаменимое средство для поиска источников лагов на сервере, так как сохраняет не только статистику загрузки системы, но и показатели каждого процесса — то есть «долистав» до нужного момента времени можно увидеть, кто этот счастливый момент с LA > 30 создал. И что именно было причиной — IO программ, своп (нехватка памяти), процесор или что-то ещё. Помимо большего количества информации ещё способен двумя цветами подсказывать, какие параметры выходят за разумные пределы.
htop
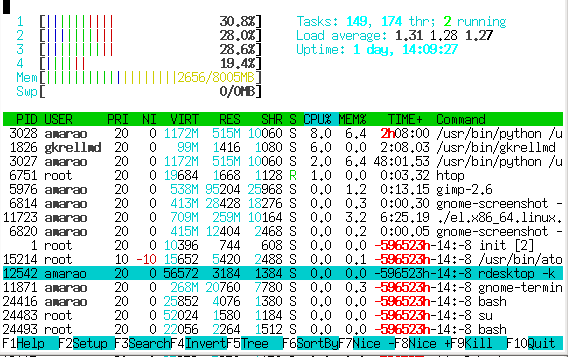
В отличие от atop, htop не собирает статистику и просто показывает текущее состояние. Второе яркое отличие — нортоноподобная панелька с подсказками кнопок снизу и возможность «навигации» по списку процессов.
Поддерживает выделение процессов и выполнения над ними групповых операций (впрочем, с форк бомбой им не справиться).
Общей статистике по системе показыват мало (зато с шкалой а-ля прогресс-бар), зато имеет обширнейшие инструменты для анализа процессов, включая баловство с скедулингом (приоритеты, affinity), просмотр списка открытых файлов, strace и массу мелких, но приятных фич, таких как контекстный поиск по имени процесса, режим «слежения» за процессом, быстрые операции с процессом и т.д.
iotop
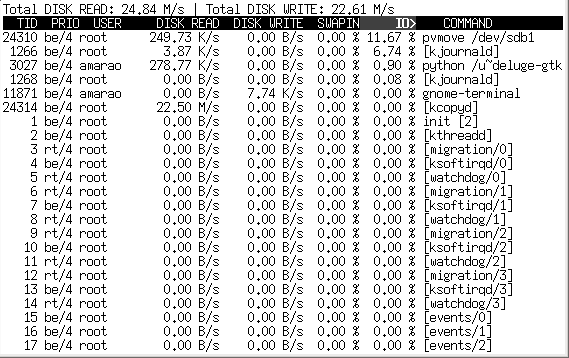
Специализированная утилита для анализа потребления дисковой полосы. К сожалению, не показывает иопсы (это вообще возможно?) Благодаря показу kernel threads способен указать на kcopy/swapper/kflush как источник хруста винта (чего не может atop). Заодно показывает общую загруженность IO системы в Мб/с (чего так же не может atop). Довольно быстрый.
iftop

Опять же, специализированная утилита, позволяющая наблюдать за трафиком в реальном времени. Требует очень рутовых прав и pcap, т.к. работает почти аналогичо tcpdump’у. Показывает загруженность интерфейса (поддерживается только один интерфейс в одной копии), направления трафика и интенсивность трафика.
На средне-загруженном сервере, который внезапно начал жрать инет позволяет очень быстро найти направление, в которое идёт больше всего трафика (в любую сторону). К сожалению, не показывает распределение трафика по процессам.
powertop
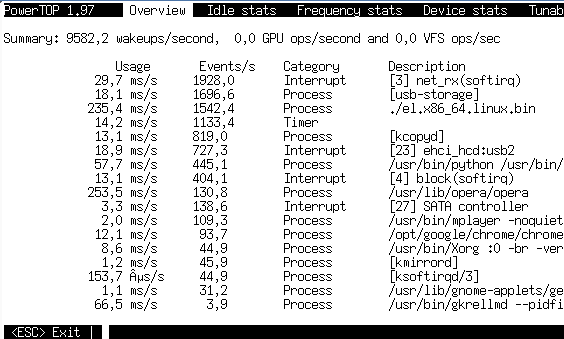
Специализированная (ага, снова) утилита от intel для мониторинга потребления мощности (электрической мощности!) разными процессами. В реальности никаких ваттов не показывает, а показывает время, затраченное на обслуживание процессором. Уникальна тем, что показывает прерывания и прочие события ядра на одном уровне с процессами (что позволяет находить нетривиальные ситуации перегрузки сервера и даже определять, от какой железки это исходит). При равной нагрузке позволяет оценить, чей драйвер шустрее работает.
Кроме того, во вкладке device stats позволяет оценить степень загруженности устройства (точнее, драйвера устройства). Для сетевых карт (включая виртуальные, типа tun) показывает pps (packets per seconds).
Во вкладке idle status показывает распределение состояний процессора (C1, C2, C3), что весьма полезно при выяснении «батарейка дохлая или что-то не так с системой?» на ноутбуках.
itop
Ну очень специализированная утилита для мониторинга прерываний (настоящих прерываний, идентификацией их по номеру).
kerneltop
Наверное, должен показывать что-то интересное про ядро. У меня дома ему не понравился System.map, а на сервере — отсутствие /proc/profile.
dnstop

Специализированный анализатор DNS-трафика на интерфейсе. Наверное, был бы очень полезен при починке DNS на контроллере домена, к сожалению, Active Directory на линуксе работает не очень хорошо.
Безусловно полезно для нахождения засранца, загоняющего бинд в неприличный LA.
jnettop
Почти клон iftop, однако имеет забавный режим, когда может слушать соседей и показывать top по их трафику. Не очень работает в эпоху коммутаторов.
Ещё умеет агрегацию адресов (так, чтобы показывать их трафик одной строкой).
sntop
Замечательная штука для скринсейвера или публичного монитора — по конфигу рассылает пинги и показывает, если какой-то хост лёг. В принципе, в рабочих условиях при настроенном конфиге позволяет быстро оценить состояние не очень большого парка серверов (запустили — и сразу красным видно, кто лежит).
latencytop
Я бы с интересом на него посмотрел, но оно требует особого конфига ядра…
xrestop

Монитор потребления ресурсов X-сервера разными приложениями, которые к нему подключились. (Обнаружил, что хром жрёт ресурсов х-сервера много больше, чем опера).
slabtop

Специализируется на структурах данных SLAB ядра, фактически, показывает использование памяти в более тонких категориях, чем «свободно/занято/кеш». View only, несколько режимов сортировки.
Software specific
apachetop
Не столь полезен, как хотелось бы, показывает статистику ответов на запросы. Никакой магии, просто читает логи апача.
sqtop
Топ по логам сквида. С учётом скорости их роста, сначала генерирует промежуточную статистику, а потом уже даёт по ней шариться.
pg_top
Пакет в debian почему-то называется ptop. Мониторит загрузку postgresql.
mytop
Мониторит mysql. Есть альтернативный mtop, делает примерно то же, но заброшен и (в дебиане) выпилен в районе lenny -> squeeze.
xentop

Мониториг доменов xen’а. Интересен тем, что показывает не только память-процессор, но и дисковые операции с сетью. К сожалению, никакого управления, view only. Единственный из всех top’ов, не влазящий в 80 столбцов при выводе.
Список топов, которые я глазами не посмотрел:
hatop — мониторинг haproxy
virt-top — мониторинг за работой libvirt
mctop — мониторинг состояния memcached
perf-top — нашёл документацию, самого perf-top в виде тарбола или пакета не нашёл.
offTOP
Сначала ложные топы кратко:
gkrelmtop — плагин под gkrelm (монитор производительности в гуе) — оффтопик.
ntop — нарушает text-based традицию интерактивных программ и ставится как сайт для апача.
libgtop — библиотека для мониторигна производительности
nload — консольный монитор сетевой активности, в отличие от обычных top’ов не выводит рейтинг, а рисует текстовый график.
А потом настоящие топы без уважительного суффикса ‘top’ в названии.
nethogs

Отображает сетевой трафик от конкретных приложений.
iptstate

Монитор contrack из iptables, показывает активные трансляции с возможностью их прибить. Фактически, близок к цисковому sh ip nat tra , но удобнее (спасибо за наводку тов. @merlin_rterm).
How to monitor cpu power consumption in watts on Ubuntu
So recently I was looking for a command to check the live power consumption of cpu in watts. I tried different commands like powertop, powerstat, lm-sensors but none of them worked properly.
lm-sensors did show the temperatures of individual cores of the cpu, but could not display the watts being consumed in realtime. Other commands like powertop and powerstat also were not able to show up the information i wanted.
Finally found 2 new commands called turbostat and s-tui that were able to do the task.
When doing stress tests on cpu, its important to monitor the power consumption and temperatures to see how much power is being drawn and how effectively is it being dissipated by the cooling system. Such tests are done both desktop pcs and laptops.
The power metric can be used to check the maximum drawn power under full load and helps us decide as to what kind of psu would be best suitable for a target desktop build and the temperature data along with tdp values lets us decide which cooler would be best for the cpu.
Its not just about diagnostics but also selecting parts for a new build.
1. Turbostat
Turbostat is an excellent command line utility that can measure and monitor lots of hardware metrics on the system.
If its not already available on the system, it should be possible to install it with the apt-get or apt command.
root@li240-5:~# turbostat Command 'turbostat' not found, but can be installed with: apt install linux-intel-iotg-tools-common # version 5.15.0-1017.22, or apt install linux-nvidia-tools-common # version 5.15.0-1007.7 apt install linux-tools-common # version 5.15.0-52.58 root@li240-5:~#
The following turbostat command example displays the cpu usage (%), clock frequency (mhz), temperature (C) and power consumption (watts). These are the 4 most important performance metrics to check when stress testing the cpu.
$ sudo turbostat --Summary --quiet --show Busy%,Avg_MHz,PkgTmp,PkgWatt --interval 1 Avg_MHz Busy% PkgTmp PkgWatt 86 4.92 52 3.89 101 5.04 52 4.42 91 5.10 51 3.81 100 5.14 52 4.34 100 5.90 51 3.96 160 6.73 53 5.64 185 11.30 52 5.70 364 18.40 52 8.16 230 15.39 52 5.76 657 29.90 63 11.14 382 21.21 53 7.24 552 28.48 53 9.31 415 20.86 52 8.10 949 37.65 64 15.37 1204 35.40 63 24.98 1275 40.87 53 23.28 1385 50.62 56 20.67 914 46.80 53 12.57 423 26.42 53 7.07 2696 83.71 64 34.41 2978 89.87 64 37.54 2907 87.59 66 37.18 3044 91.87 64 38.65 2993 90.31 67 38.26 3152 95.35 69 39.86 3219 97.40 67 41.21 3247 98.31 68 41.72 3281 99.39 68 42.44 3256 98.62 69 42.23 3192 96.61 73 41.89 3244 98.23 69 42.27 3298 99.93 69 42.60 3300 100.00 70 42.63 3300 100.00 70 42.72 3300 100.00 71 42.73
The column PkgWatt shows the power consumption watts. As the usage increases so does the watt intake along with the temperature of the cpu.
To plot the graph of the power consumption use the ttyplot utility as shown below:
$ sudo turbostat --Summary --quiet --show PkgWatt --interval 1 | gawk '< printf("%.2f\n" , $1); fflush(); >' | ttyplot -s 100 -t "Turbostat - CPU Power (watts)" -u "watts"
The above command will use gawk to extract the wattage data and feed it to ttyplot, which will then plot a decent graph in the terminal itself. Not very fancy but good enough!
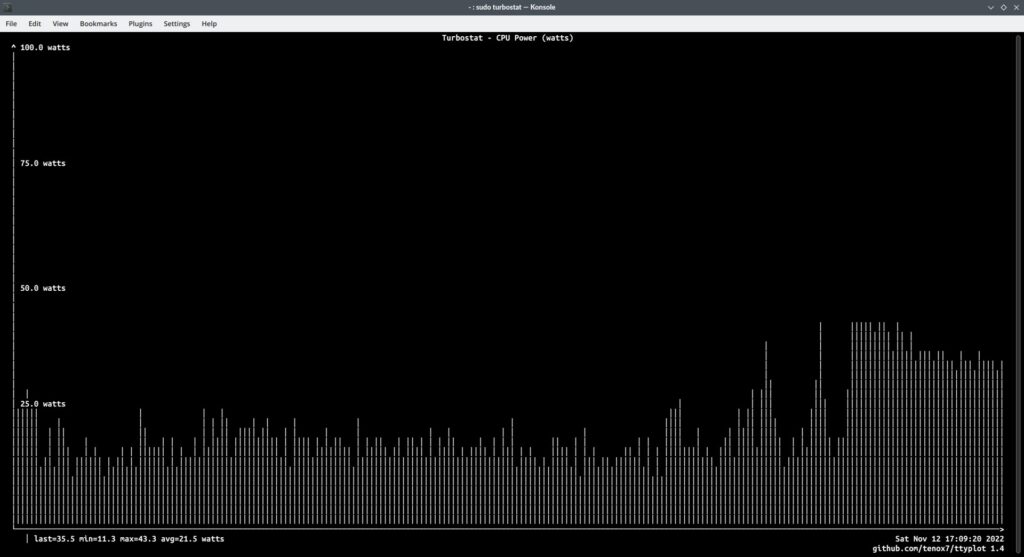
Turbostat CPU power graph ttyplot
2. s-tui — The Stress Terminal UI
The next tool is s-tui which displays data in both tabular and graphical format. Its needs to be run with root privileges in order to extract and display power information.
Install it using apt-get on ubuntu.
sudo apt-get install s-tui
On Fedora s-tui can be installed from the main repository using dnf. Run «sudo dnf install s-tui» and you are done.
Now run with root privileges:
sudo s-tui
Thats it, and now you should be able to view the desired data.
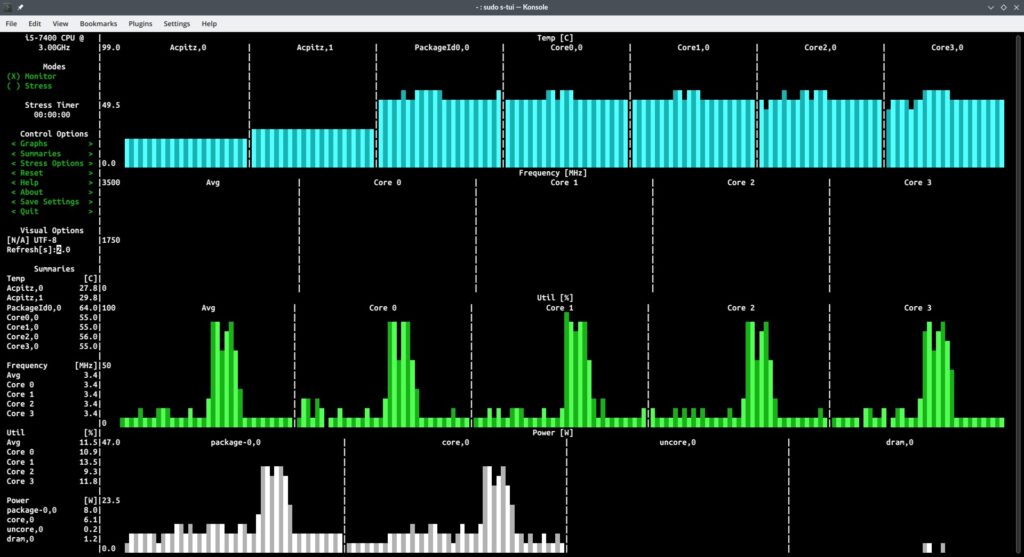
s-tui cpu performance metrics
Conclusion
I have tested both turbostat and s-tui on multiple cpus like i5-7400 (desktop), i5-1135g7 (laptop), ryzen 7 5800h (laptop) and ryzen 5 5500u (laptop) and they work pretty well on all systems.
The tools should show power information on most modern cpus from both intel and amd.
The power information will not be available if you are running linux in a virtual machine like virtualbox, so don’t bother.
Category: Guides Linux Linux Commands Ubuntu Tags:
About Silver Moon
A Tech Enthusiast, Blogger, Linux Fan and a Software Developer. Writes about Computer hardware, Linux and Open Source software and coding in Python, Php and Javascript. He can be reached at [email protected] .
2 Comments
- Samuel September 1, 2023 at 2:02 pm This is interesting, thanks to turbostat I can see the C-states in a nice table. But I am not sure about the absolute values, especially with only the Watts for “pkg”. With “perf stat” there is also a “psys”. Here two lines from a one-second-run, 1 Joule = 1 Watt/second: 1.26 Joules energy-psys
0.80 Joules energy-pkg
… Even this energy-psys only “reflects” the Watts indicated by my real (external) power meter. I read between 2.8 – 4.2 W depending on the kernel/distro. Good idling is with 3.2W real, 1W psys and a cool case. Not-so-good is 3.8W real, 3W psys and “feverish” case after 15 minutes. I am not even convinced the power meter manages to measure the (variable?) current precisely. 25 W noturbo, 75% pstate limit
4.0 W minimal activity / bad idling
3.2 W good idling (can even stay at 2.8 W – but how exactly. )
1.8 W “freeze”
1.1 W suspend-to-ram
0.9 W (!) Main power Off This is with a 2017 intel nuc mini-pc. The numbers show you CAN get quite close to “freeze” system state. Feeling the warmth of the case is the best control, especially when the fan is not blowing (yet).
- Silver Moon Post author September 6, 2023 at 8:08 pm that’s a good idea, specially for a “mobile” form factor device that can tell its heat levels through body touch.
9 Commands to Check CPU Information on Linux
The cpu information includes details about the processor, like the architecture, vendor name, model, number of cores, speed of each core etc.
There are quite a few commands on linux to get those details about the cpu.
In this post we shall take a look at some of the commonly used commands that can be used to get details about the cpu.
1. /proc/cpuinfo
The /proc/cpuinfo file contains details about individual cpu cores.
Output its contents with less or cat.
$ less /proc/cpuinfo processor : 0 vendor_id : GenuineIntel cpu family : 6 model : 23 model name : Intel(R) Core(TM)2 Quad CPU Q8400 @ 2.66GHz stepping : 10 microcode : 0xa07 cpu MHz : 1998.000 cache size : 2048 KB physical id : 0 siblings : 4 core id : 0 cpu cores : 4 apicid : 0 initial apicid : 0 fpu : yes fpu_exception : yes cpuid level : 13 wp : yes flags : fpu vme de pse tsc msr pae mce cx8 apic sep mtrr pge mca cmov pat pse36 clflush dts acpi mmx fxsr sse sse2 ss ht tm pbe syscall nx lm constant_tsc arch_perfmon pebs bts rep_good nopl aperfmperf pni dtes64 monitor ds_cpl vmx est tm2 ssse3 cx16 xtpr pdcm sse4_1 xsave lahf_lm dtherm tpr_shadow vnmi flexpriority bogomips : 5303.14 clflush size : 64 cache_alignment : 64 address sizes : 36 bits physical, 48 bits virtual power management:
Every processor or core is listed separately the various details about speed, cache size and model name are included in the description.
To count the number of processing units use grep with wc
$ cat /proc/cpuinfo | grep processor | wc -l 4
The number of processors shown by /proc/cpuinfo might not be the actual number of cores on the processor. For example a processor with 2 cores and hyperthreading would be reported as a processor with 4 cores.
To get the actual number of cores, check the core id for unique values
$ cat /proc/cpuinfo | grep 'core id' core id : 0 core id : 2 core id : 1 core id : 3
So there are 4 different core ids. This indicates that there are 4 actual cores.
2. lscpu — display information about the CPU architecture
lscpu is a small and quick command that does not need any options. It would simply print the cpu hardware details in a user-friendly format.
$ lscpu Architecture: x86_64 CPU op-mode(s): 32-bit, 64-bit Byte Order: Little Endian CPU(s): 4 On-line CPU(s) list: 0-3 Thread(s) per core: 1 Core(s) per socket: 4 Socket(s): 1 NUMA node(s): 1 Vendor ID: GenuineIntel CPU family: 6 Model: 23 Stepping: 10 CPU MHz: 1998.000 BogoMIPS: 5303.14 Virtualization: VT-x L1d cache: 32K L1i cache: 32K L2 cache: 2048K NUMA node0 CPU(s): 0-3
3. hardinfo
Hardinfo is a gtk based gui tool that generates reports about various hardware components. But it can also run from the command line only if there is no gui display available.
$ hardinfo | less
It would produce a large report about many hardware parts, by reading files from the /proc directory. The cpu information is towards the beginning of the report. The report can also be written to a text file.
Hardinfo also performs a few benchmark tests taking a few minutes before the report is displayed.
4. lshw
The lshw command can display limited information about the cpu. lshw by default shows information about various hardware parts, and the ‘-class’ option can be used to pickup information about a specific hardware part.
$ sudo lshw -class processor *-cpu description: CPU product: Intel(R) Core(TM)2 Quad CPU Q8400 @ 2.66GHz vendor: Intel Corp. physical id: 0 bus info: cpu@0 version: Intel(R) Core(TM)2 Quad CPU Q8400 @ 2.66GHz slot: LGA 775 size: 1998MHz capacity: 4GHz width: 64 bits clock: 333MHz capabilities: fpu fpu_exception wp vme de pse tsc msr pae mce cx8 apic sep mtrr pge mca cmov pat pse36 clflush dts acpi mmx fxsr sse sse2 ss ht tm pbe syscall nx x86-64 constant_tsc arch_perfmon pebs bts rep_good nopl aperfmperf pni dtes64 monitor ds_cpl vmx est tm2 ssse3 cx16 xtpr pdcm sse4_1 xsave lahf_lm dtherm tpr_shadow vnmi flexpriority cpufreq
The vendor, model and speed of the processor are being shown correctly. However it is not possible to deduce the number of cores on the processor from the above output.
5. nproc
The nproc command just prints out the number of processing units available. Note that the number of processing units might not always be the same as number of cores.
$ nproc 4
6. dmidecode
The dmidecode command displays some information about the cpu, which includes the socket type, vendor name and various flags.
$ sudo dmidecode -t 4 # dmidecode 2.12 SMBIOS 2.4 present. Handle 0x0000, DMI type 4, 35 bytes Processor Information Socket Designation: LGA 775 Type: Central Processor Family: Pentium D Manufacturer: Intel(R) Corporation ID: 7A 06 01 00 FF FB EB BF Signature: Type 0, Family 6, Model 23, Stepping 10 Flags: FPU (Floating-point unit on-chip) VME (Virtual mode extension) DE (Debugging extension) PSE (Page size extension) TSC (Time stamp counter) MSR (Model specific registers) PAE (Physical address extension) MCE (Machine check exception) CX8 (CMPXCHG8 instruction supported) APIC (On-chip APIC hardware supported) SEP (Fast system call) MTRR (Memory type range registers) PGE (Page global enable) MCA (Machine check architecture) CMOV (Conditional move instruction supported) PAT (Page attribute table) PSE-36 (36-bit page size extension) CLFSH (CLFLUSH instruction supported) DS (Debug store) ACPI (ACPI supported) MMX (MMX technology supported) FXSR (FXSAVE and FXSTOR instructions supported) SSE (Streaming SIMD extensions) SSE2 (Streaming SIMD extensions 2) SS (Self-snoop) HTT (Multi-threading) TM (Thermal monitor supported) PBE (Pending break enabled) Version: Intel(R) Core(TM)2 Quad CPU Q8400 @ 2.66GHz Voltage: 1.6 V External Clock: 333 MHz Max Speed: 4000 MHz Current Speed: 2666 MHz Status: Populated, Enabled Upgrade: Socket LGA775 L1 Cache Handle: 0x0003 L2 Cache Handle: 0x0001 L3 Cache Handle: Not Provided Serial Number: Not Specified Asset Tag: Not Specified Part Number: Not Specified
7. cpuid
The cpuid command fetches CPUID information about Intel and AMD x86 processors.
The program can be installed with apt on ubuntu
$ sudo apt-get install cpuid
And here is sample output
$ cpuid . Vendor ID: "GenuineIntel"; CPUID level 13 Intel-specific functions: Version 0001067a: Type 0 - Original OEM Family 6 - Pentium Pro Model 7 - Pentium III/Pentium III Xeon - external L2 cache Stepping 10 Reserved 4 Extended brand string: "Intel(R) Core(TM)2 Quad CPU Q8400 @ 2.66GHz" CLFLUSH instruction cache line size: 8 Initial APIC ID: 2 Hyper threading siblings: 4 Feature flags bfebfbff: FPU Floating Point Unit VME Virtual 8086 Mode Enhancements DE Debugging Extensions PSE Page Size Extensions TSC Time Stamp Counter MSR Model Specific Registers PAE Physical Address Extension MCE Machine Check Exception CX8 COMPXCHG8B Instruction APIC On-chip Advanced Programmable Interrupt Controller present and enabled SEP Fast System Call MTRR Memory Type Range Registers PGE PTE Global Flag MCA Machine Check Architecture CMOV Conditional Move and Compare Instructions FGPAT Page Attribute Table PSE-36 36-bit Page Size Extension CLFSH CFLUSH instruction DS Debug store ACPI Thermal Monitor and Clock Ctrl MMX MMX instruction set FXSR Fast FP/MMX Streaming SIMD Extensions save/restore SSE Streaming SIMD Extensions instruction set SSE2 SSE2 extensions SS Self Snoop HT Hyper Threading TM Thermal monitor 31 reserved .
8. inxi
Inxi is a script that uses other programs to generate a well structured easy to read report about various hardware components on the system. Check out the full tutorial on inxi.
$ sudo apt-get install inxi
Print out cpu/processor related information
$ inxi -C CPU: Quad core Intel Core2 Quad CPU Q8400 (-MCP-) cache: 2048 KB flags: (lm nx sse sse2 sse3 sse4_1 ssse3 vmx) Clock Speeds: 1: 1998.00 MHz 2: 1998.00 MHz 3: 1998.00 MHz 4: 1998.00 MHz
To learn more about the inxi command and its usage check out this post:
How to use «Inxi» to check Hardware Information on Linux
9. Hwinfo
The hwinfo command is a hardware information program that can be used to collect details about various hardware components on a Linux system.
It also displays information about the processor. Here is a quick example:
$ hwinfo --short --cpu cpu: Intel(R) Core(TM) i5-7400 CPU @ 3.00GHz, 2275 MHz Intel(R) Core(TM) i5-7400 CPU @ 3.00GHz, 2262 MHz Intel(R) Core(TM) i5-7400 CPU @ 3.00GHz, 2058 MHz Intel(R) Core(TM) i5-7400 CPU @ 3.00GHz, 2133 MHz $
If you don’t use the «—short» option it will display much more information about each cpu core like architecture and processor features.
To learn more about the hwinfo command check this post:
Check hardware information on Linux with «hwinfo» command
Conclusion
Those were some of the commands to check CPU information on Linux based systems like Ubuntu, Fedora, Debian, CentOS etc.
For some more command examples on checking cpu information check this post:
How to Check Processor and CPU Details on Linux — Command Examples
Most of the commands are command line based and show text output. For a GUI interface use the program called Hardinfo.
It shows hardware details about various components in a easy to use GUI interface.
If you know of any other useful command that can display information about the CPU, let us know in the comments below.
Category: Linux Tags: linux commands, linux hardware information, linux server
About Silver Moon
A Tech Enthusiast, Blogger, Linux Fan and a Software Developer. Writes about Computer hardware, Linux and Open Source software and coding in Python, Php and Javascript. He can be reached at [email protected] .
15 Comments
- SahilMarch 2, 2021 at 9:09 am Very nicely explained. I highly recommend it in my articles. thank you.